


 Start › Sea Ice Concentration › MODIS/AMSR2
 1 km Resolution Sea Ice Concentration from MODIS & AMSR2
Since October 2019, we have been producing sea-ice concentration at 1 km grid resolution retrieved jointly from MODIS and ASI-AMSR2 data. The data are available operationally between October 1st and May 31st. No retrieval is performed in Summer.
Sea-ice concentration maps
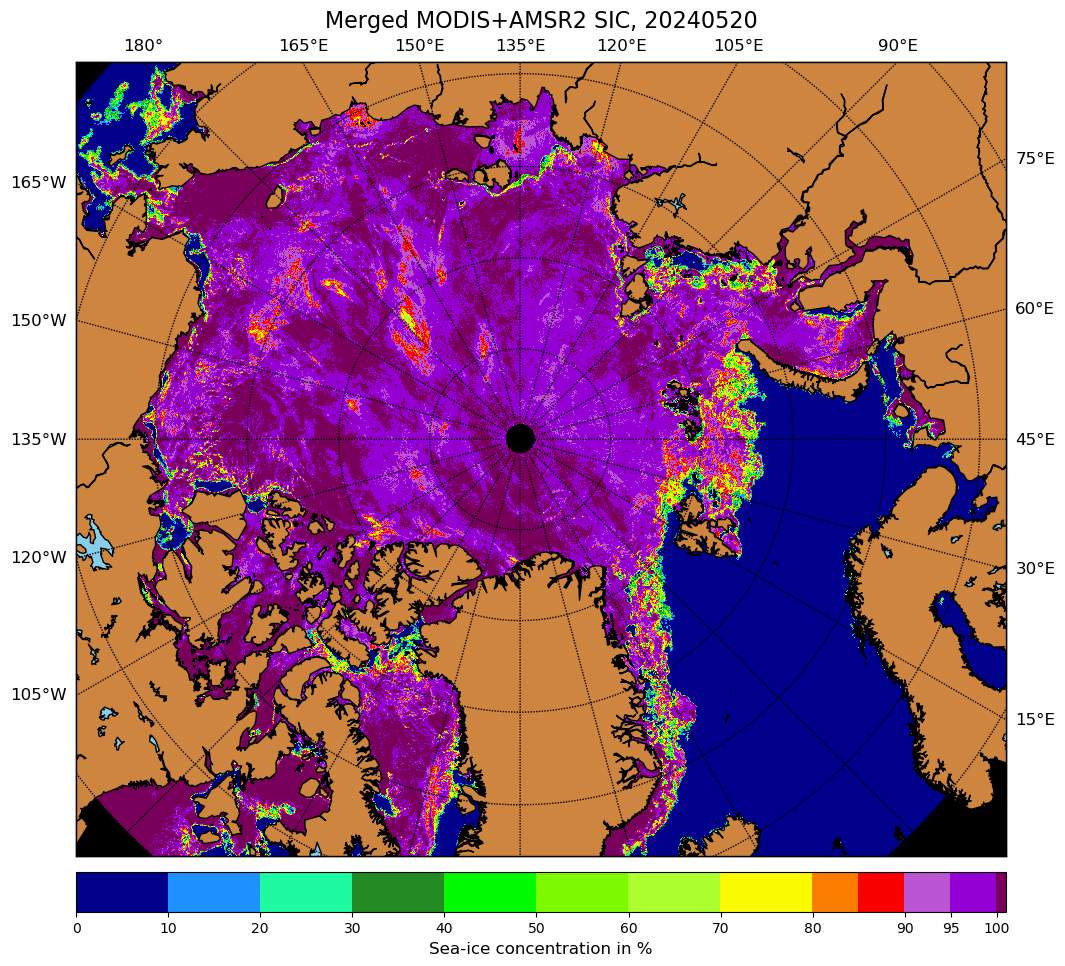
Below, you find an example for the daily mean MODIS-AMSR2 sea-ice concentration. The map is produced daily for the region north of 60°N in near-real time (approximately 25 hours latency).
Description
Thermal infrared (MODIS-Aqua) and passive microwave (AMSR2-GCOM_W1) satellite data provide complementary observations of sea ice concentration (SIC): Thermal infrared data have a high spatial resolution (1 km), but are only available in cloud-free conditions. AMSR2 data have a lower spatial resolution (5 km for the 89 GHz channels), but are available independently of cloud cover. The thermal infrared SIC is determined based on the local temperature anomaly using the algorithm presented in Drüe and Heinemann (2004) and the improvements presented in Ludwig et al (2019). The 89 GHz ASI algorithm (Spreen et al, 2008) is used for the passive microwave SIC. The merging is done in the following way: A 5x5 km box, roughly corresponding to one passive microwave footprint, is selected. In this box, the thermal infrared SIC is tuned such that their mean is equivalent to the passive microwave SIC, but their distribution is preserved. This ensures that the SIC is consistent at the transition between cloud-free and cloudy pixels. Pixels where no thermal infrared SIC is available due to cloud cover are filled by the passive microwave SIC. In this case, the actual resolution goes down to 5 km. Since both satellites are in the A-train satellite constellation, the time lag between the observations is of the order of minutes. For each overflight, thermal infrared and passive microwave SIC is calculated separately. Subsequently, the merging is done. Once the merged SIC has been calculated for all overflights, the daily mean is calculated. This procedure yields a spatially continuous sea-ice concentration product at 1 km spatial resolution, which is 5 times finer than from AMSR2 passive microwave observations. If MODIS thermal infrared data are available for the merging, the product allows improved resolution of leads and polynyas and a more accurate resolution of the sea-ice edge. Overfrozen leads show up as reduced sea-ice concentration, but are still distinguishable from the thicker surrounding sea ice.
Data availability and contact
The 1km MODIS-AMSR2 sea-ice concentration has been produced operationally since August 27, 2019. The data are operationally available for two regions: The entire Arctic (defined as region north of 60°N), and a 800-by-800-km box centered at the current position of RV Polarstern. They can be downloaded in geotiff, netCDF, png and pdf format. You find all data here: https://data.seaice.uni-bremen.de/modis_amsr2/. They can also be browsed interactively using our Data Browser. Data before August 27, 2019 are available upon request, which can be directed to vludwig(at)uni-bremen.de.
The product offered here is a mean of all overpasses (swaths) of one day. Individual swath data are available upon request from vludwig(at)uni-bremen.de. Data are available with a latency of approximately 25 hours.
During the start of the MOSAiC expedition, the envisioned start region was monitored operationally. These data are available from August 27, 2019 until October 27, 2019.
In case of questions or problems, please do not hesitate to contact Valentin Ludwig, Christian Melsheimer or Gunnar Spreen.
Citation and acknowledgement
Please help maintaining this service by properly citing and acknowledging if you use the data for publications. Please refer to Ludwig et al. (2020) in the text. The reference is given below. Also, please put the following or an equivalent statement into the Acknowledgements: "We thank the Institute of Environmental Physics, University of Bremen for the provision of the merged MODIS-AMSR2 sea-ice concentration data at https://data.seaice.uni-bremen.de/modis_amsr2 (last access [date_of_last_access])."
Reference:
- Ludwig, V., Spreen, G., Haas, C., Istomina, L., Kauker, F., and Murashkin, D.: The 2018 North Greenland polynya observed by a newly introduced merged optical and passive microwave sea-ice concentration dataset, The Cryosphere, 13, 2051-2073, doi:10.5194/tc-13-2051-2019, 2019.
- Ludwig, V., G. Spreen, & L. T. Pedersen (2020). Evaluation of a New Merged Sea-Ice Concentration Dataset at 1 km Resolution from Thermal Infrared and Passive Microwave Satellite Data in the Arctic. Remote Sens. 12(19), 3183. doi:10.3390/rs12193183 [Article (PDF file)]
References
The merging procedure is described, evaluated and applied in Ludwig et al. (2019) and Ludwig et al. (2020). The retrieval of the MODIS sea-ice concentration is based on Drüe et al., 2004, with the modifications described in Ludwig et al. (2019, 2020). The retrieval of the AMSR2 sea-ice concentration is described in Spreen et al., 2008.
- Ludwig, V., G. Spreen, & L. T. Pedersen (2020). Evaluation of a New Merged Sea-Ice Concentration Dataset at 1 km Resolution from Thermal Infrared and Passive Microwave Satellite Data in the Arctic. Remote Sens. 12(19), 3183. doi:10.3390/rs12193183 [Article (PDF file)]
- Ludwig, V., Spreen, G., Haas, C., Istomina, L., Kauker, F., and Murashkin, D. (2019). The 2018 North Greenland polynya observed by a newly introduced merged optical and passive microwave sea-ice concentration dataset. The Cryosphere, 13, 2051–2073. doi:10.5194/tc-13-2051-2019
- Drüe, C., and Heinemann, G. (2004): High-resolution maps of the sea-ice concentration from MODIS satellite data, Geophys. Res. Lett., 31, L20403, doi:10.1029/2004GL020808
- Spreen, G., L. Kaleschke, and G.Heygster (2008), Sea ice remote sensing using AMSR-E 89 GHz channels J. Geophys. Res.,vol. 113, C02S03, doi:10.1029/2005JC003384
We gratefully acknowledge the provision of MODIS ice surface temperature data by the National Snow and Ice Data Center (NSIDC).
We gratefully acknowledge the provision of the MODIS geolocation data by the Level-1 and Atmosphere Archive & Distribution System (LAADS) Distributed Active Archive Center (DAAC).
We gratefully acknowledge the provision of the AMSR2 89 GHz brightness temperature data by the Japan Aerospace Exploration Agency (JAXA).